In line with our appoach to modular software design, we have
available a module that builds on (and requires) the Automatic
and Trading Signals modules. This exciting module contains
two features to use Elliott Wave analysis even more beneficially.
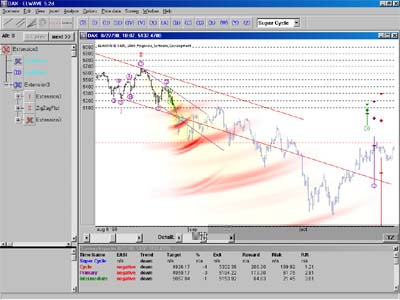
Target Zones
The Target Zones combine Fibonacci time and price
targets in combination with wave count alternatives to project
an expected path for future price movements. In addition hot
spots are visualized in the chart, which show high probability
target zones where prices are expected to travel to or to
meet resistance.
ELWAVE projects Target Zones for multiple time frames.
As you can see there are two Target paths projected
and each time this stock finds support at the projected
resistance zones. (Note: The greyed out data is not
part of the analysis, it shows the actual movement of
the stock after the analysis was made.)
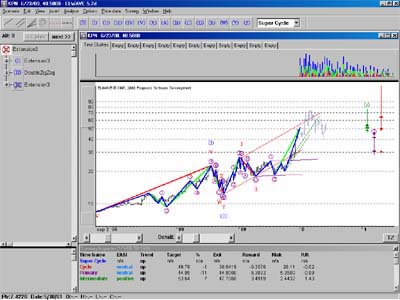
Time Clusters
The Time Clusters indicator projects sensitive time
periods where important reversals are more likely. The more
clusters near a specific date, the better the chances that
the market will reverse from a top or bottom or at least meets
important resistance. These time clusters can be based on
the patterns found by the automatic Elliott analysis or on
a user-defined swing filter using Fibonacci ratios. It is
an interesting research tool for determining at what point
in time important changes can occur.
Use the Time Clusters indicator to look for possible
turning points in time.